Hi, It's Yahya
I'm a
I build business-intelligence experiences that turn raw data into clear decisions — combining Power BI, SQL, DAX, Python, and storytelling into dashboards that feel clean, sharp, and stakeholder-ready.
0
Projects Completed
0
Dashboards Built
0
Internship Experience

About Me
What I Do
I transform raw business data into clear dashboards, KPIs, and insights that support smarter decisions.
My Focus
Power BI reporting, SQL analysis, data cleaning, DAX measures, dashboard design, and storytelling.
My Mindset
I focus on business value, clean visuals, analytical thinking, and continuous improvement.
Education
High School - General Science
Graduated in General Science with a total score of 16/20, building a strong foundation in analytical thinking and problem-solving.
Online Courses
Completed online courses from FreeCodeCamp and Coursera, gaining valuable skills in web development, programming fundamentals, and problem-solving.
IBM Full Stack Software Developer Certification
Achieved the IBM Full Stack Software Developer certificate, strengthening my knowledge in front-end, back-end, and modern web technologies.
Data Analytics & BI Learning Journey
Built strong practical skills in Excel, SQL, Power BI, Python, Power Query, DAX, dashboard design, and analytical storytelling through bootcamp projects and internship work.
Skills
A focused analytics stack built around business intelligence, clean data models, automation, and presentation-ready storytelling.
Power BI
SQL
DAX
Power Query
Python
Excel
MySQL
Dashboard Design
Data Storytelling
Data Modeling
Power BI Service
PowerPoint
Certifications
Microsoft PL-300
Power BI Data Analyst Associate
View CredentialIBM Full Stack
Full Stack Software Developer
View CredentialCodebasics Internship
Data Analyst Internship Experience
View CredentialData Analytics Certificate
Professional Data Analytics Program
View CredentialProjects
A cinematic project hub for BI dashboards, Python analytics apps, and SQL case studies — built to feel interactive, premium, and decision-focused.
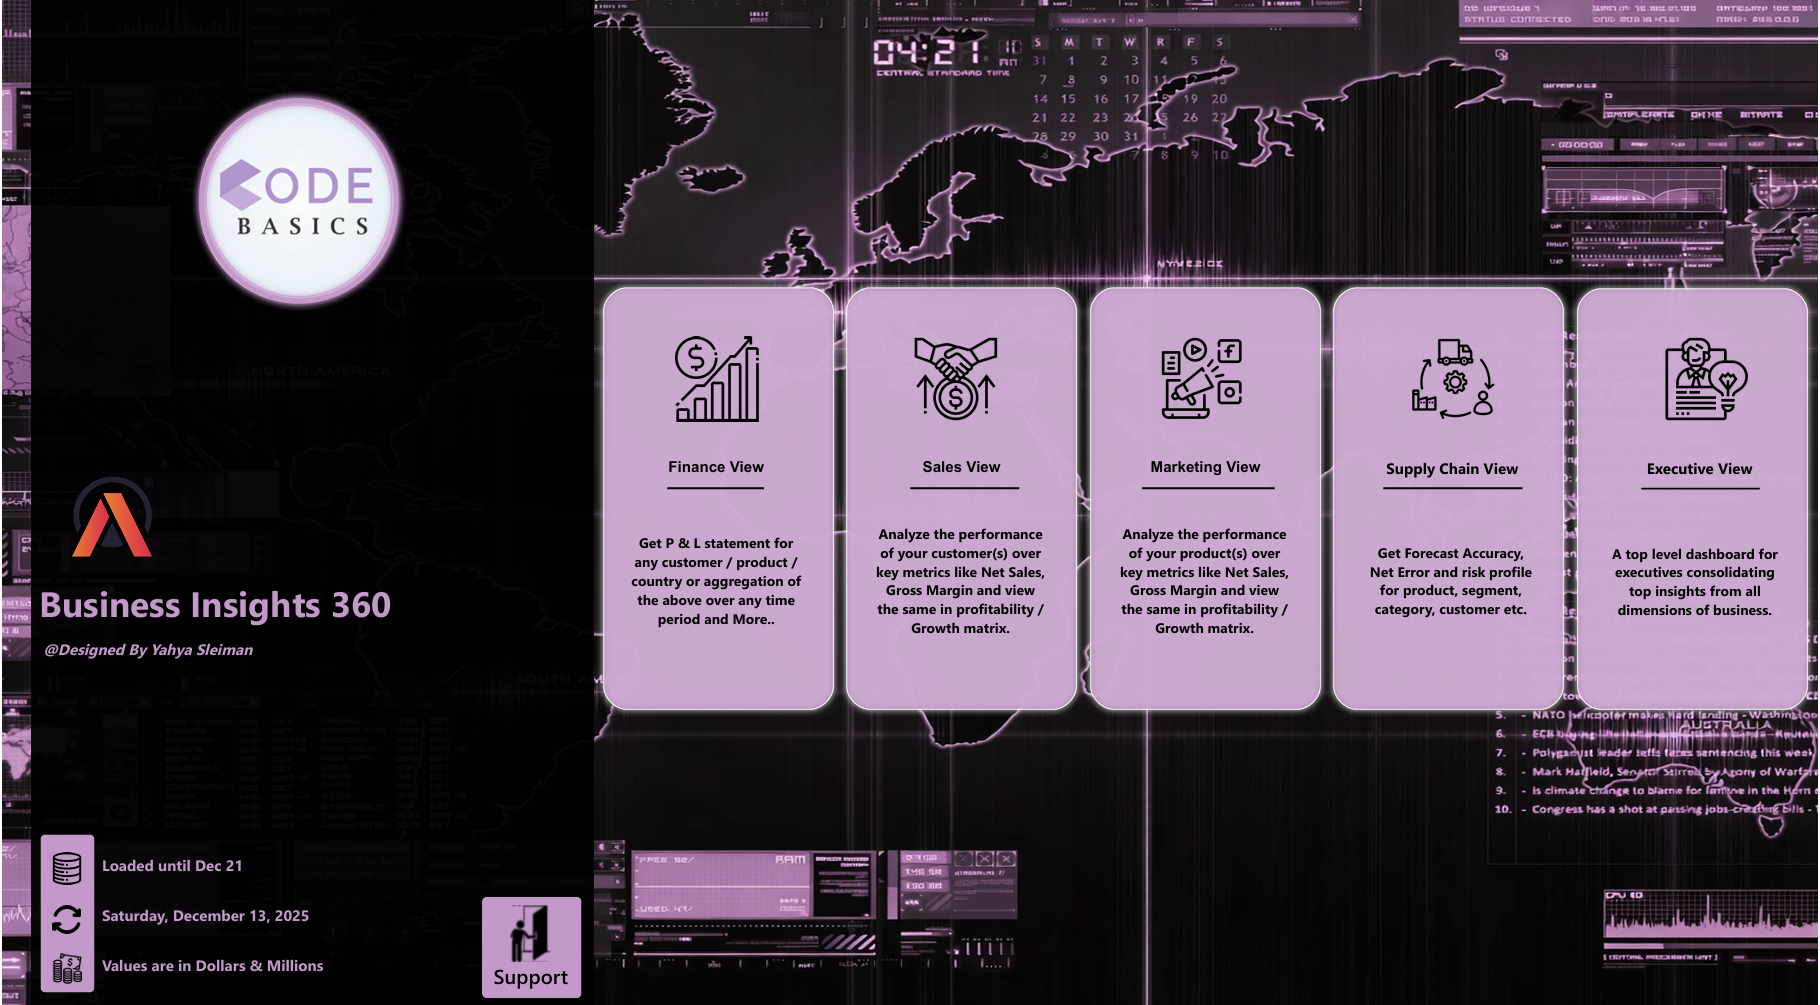
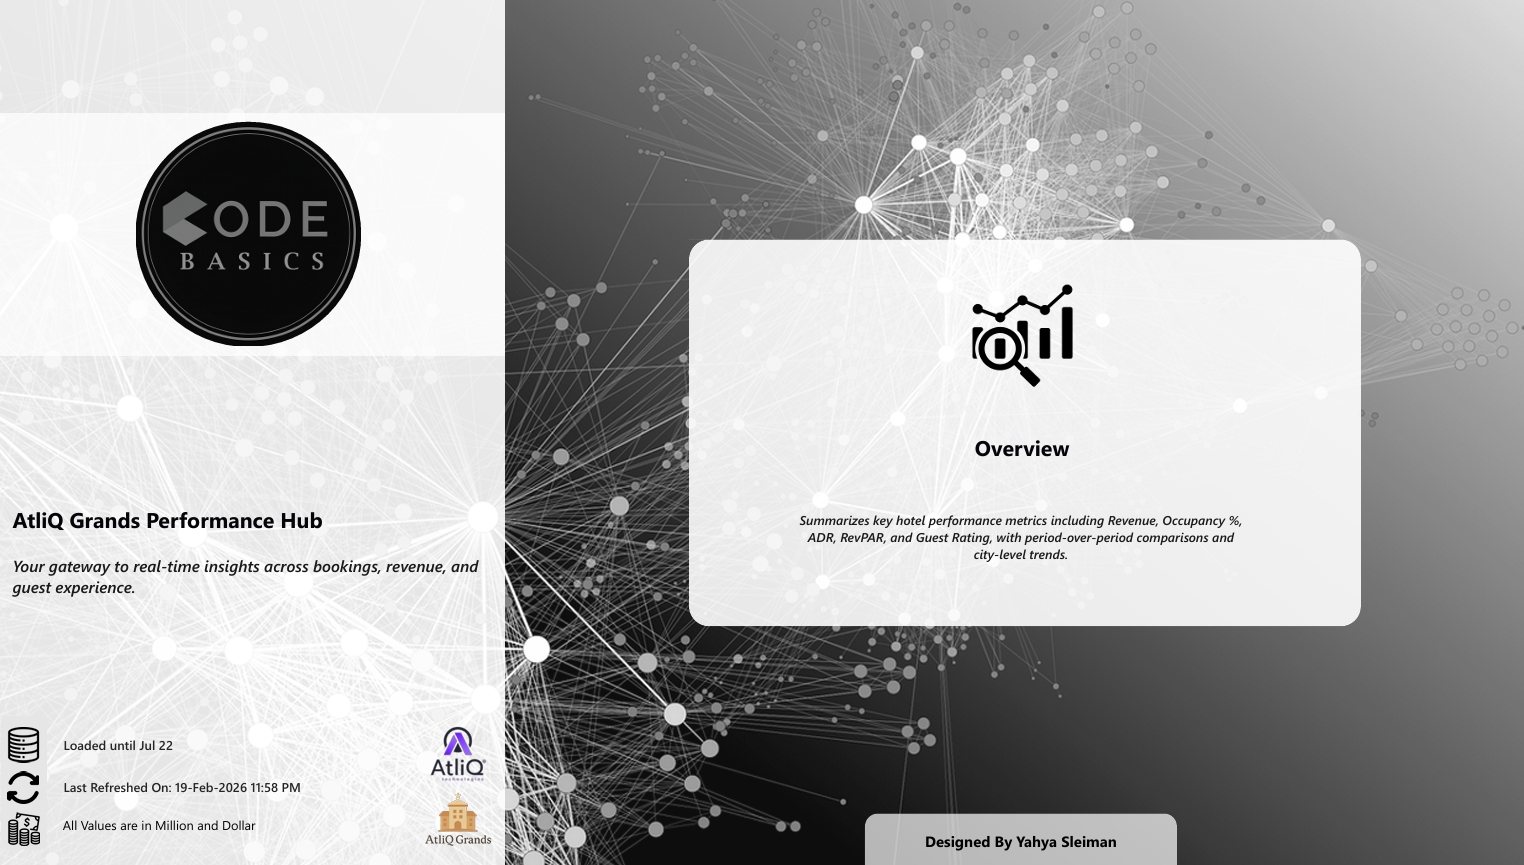
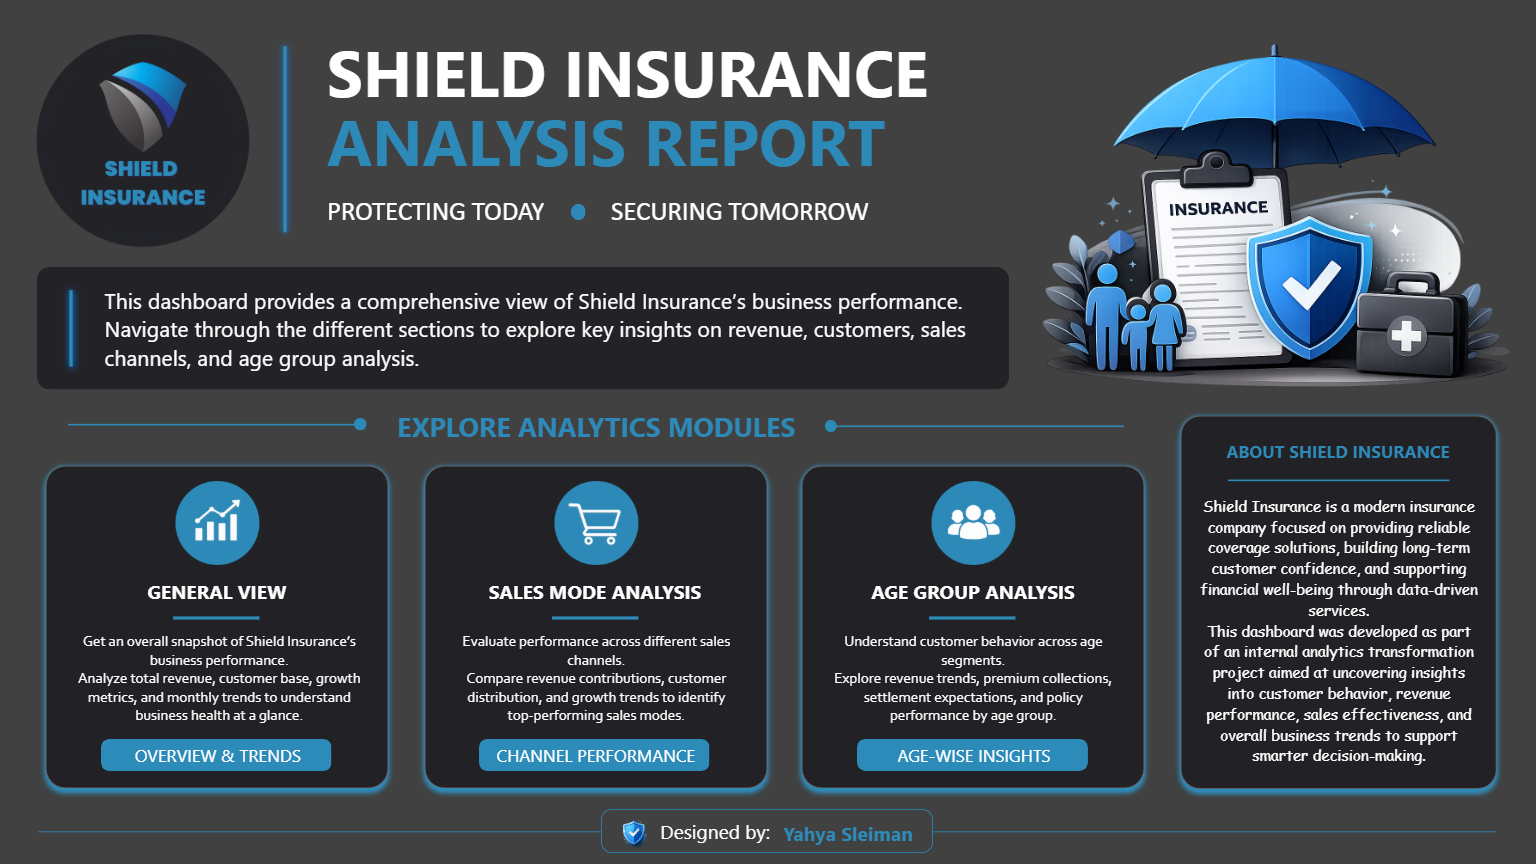
Power BI Projects
Dashboards, DAX, data modeling, KPI design, storytelling, and stakeholder-ready insights.
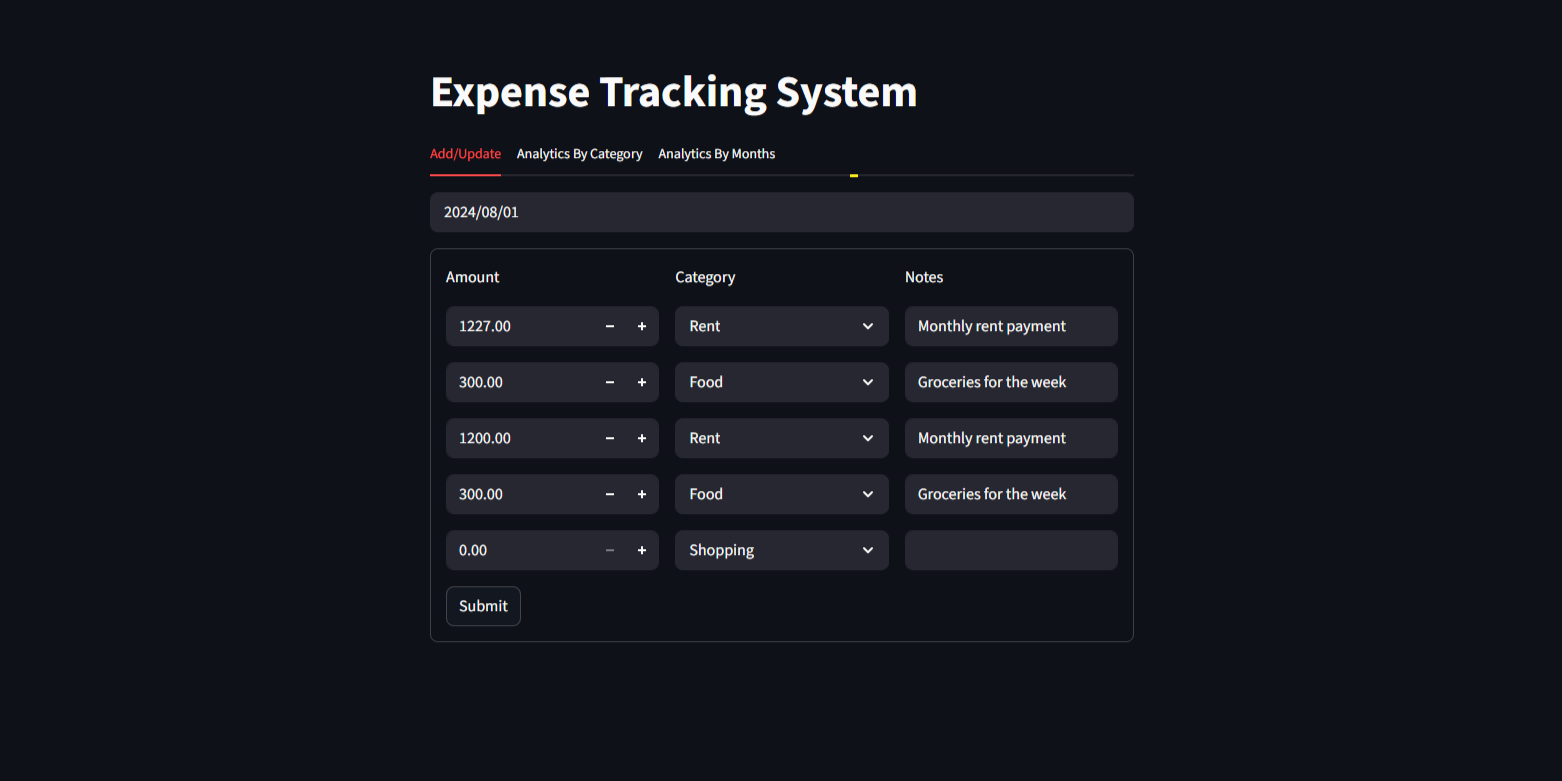
Python Projects
Automation, pandas analysis, FastAPI endpoints, Streamlit apps, and analytics workflows.
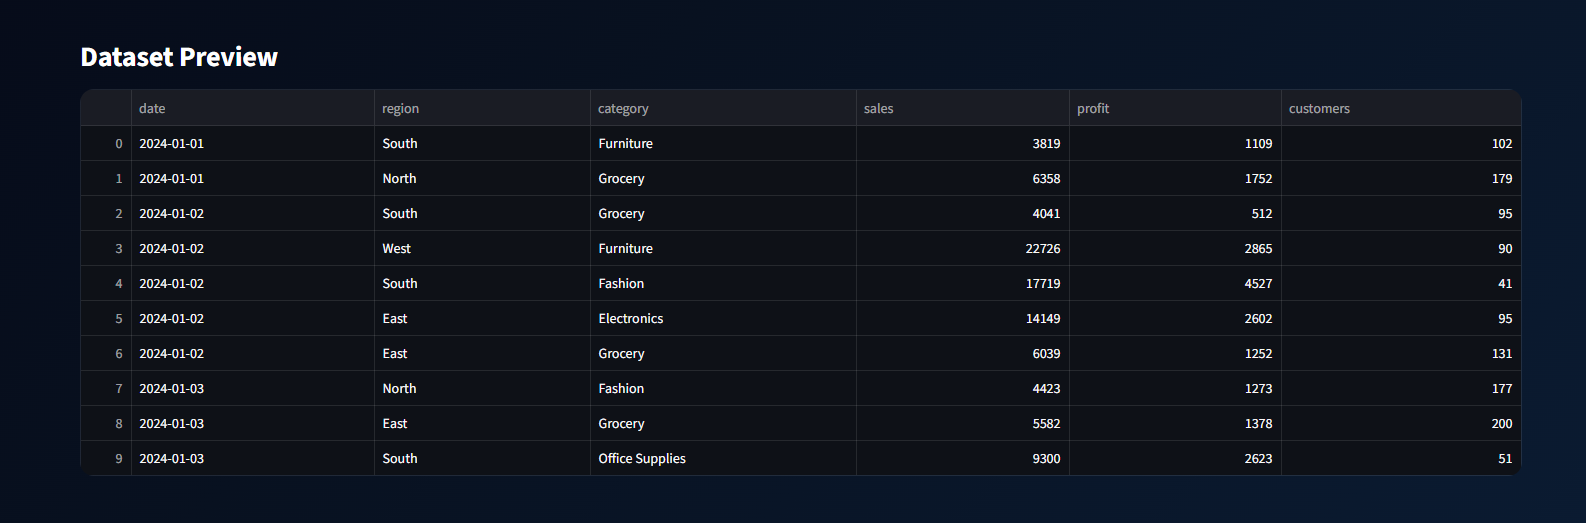
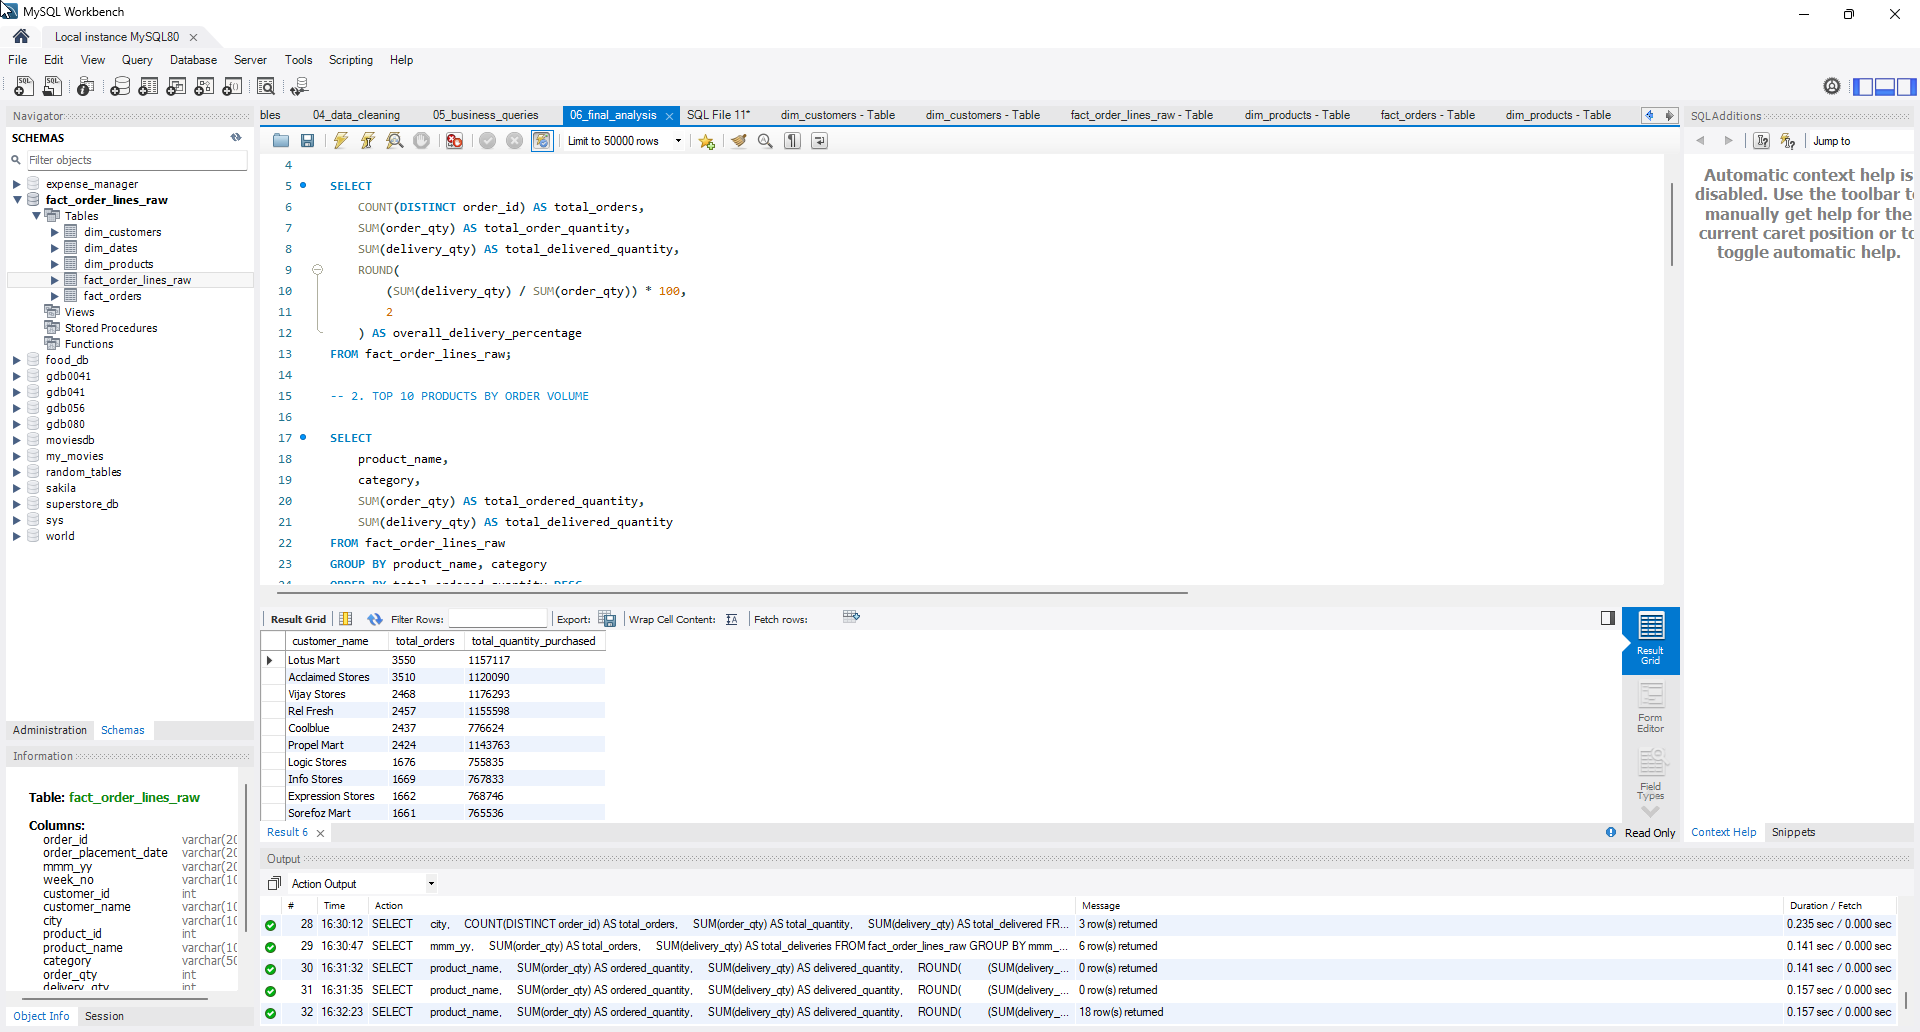
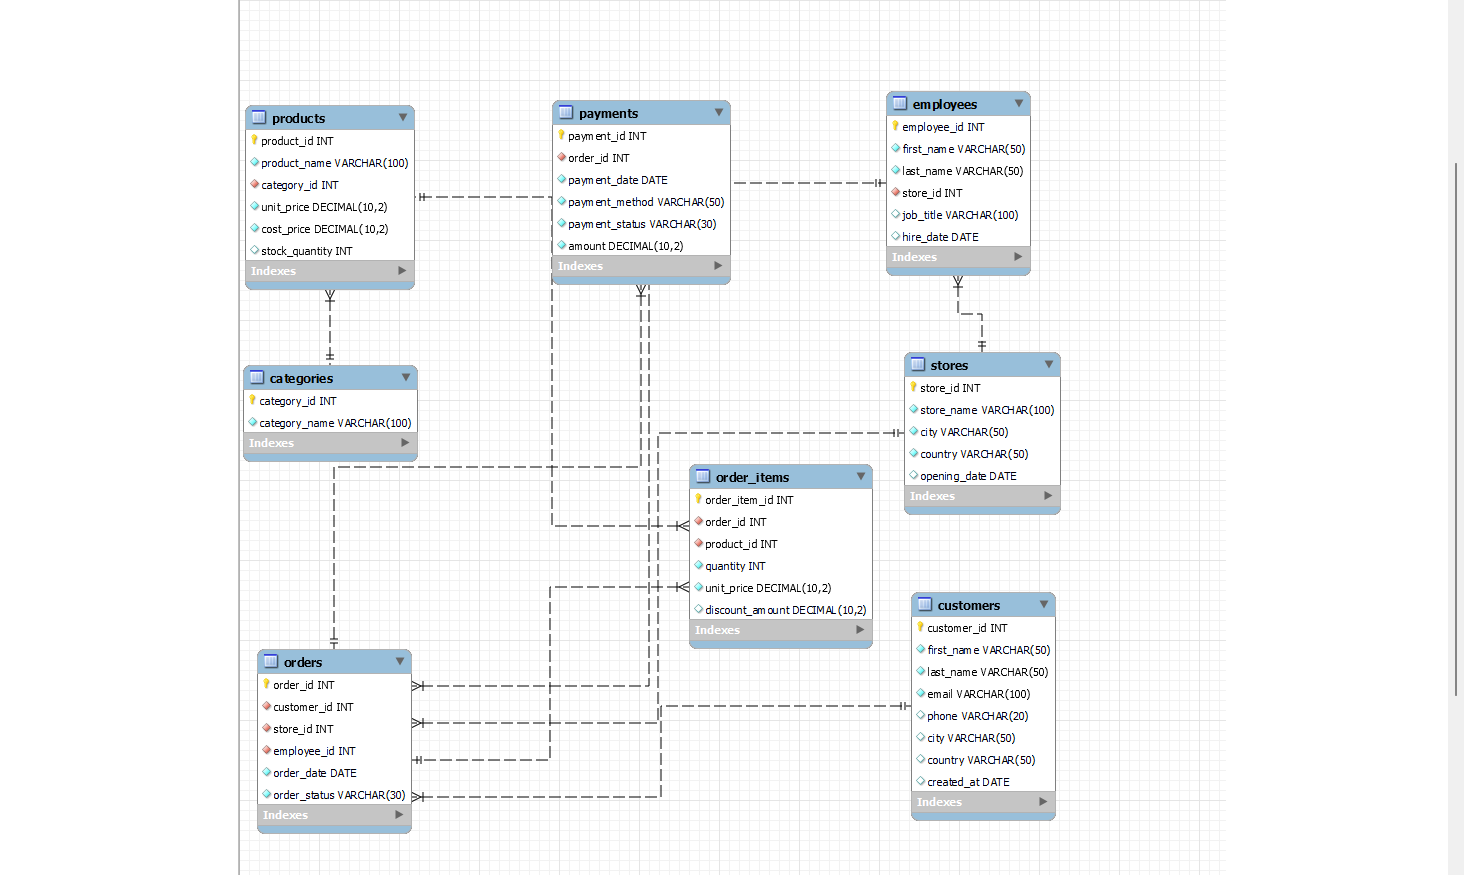
SQL Projects
Retail revenue analysis, order analytics, schema design, joins, aggregations, stored procedures, and business-ready SQL outputs.
Project Story
Understand
Start with the business question, stakeholders, KPIs, and decision context.
Model
Clean data, build relationships, create measures, and prepare a reliable analytical layer.
Visualize
Design dashboards with clear hierarchy, filters, trend analysis, and interactive storytelling.
Recommend
Turn insights into actions that help teams improve performance and make better decisions.
Contact Me
Interested in working together or reviewing my projects? Let’s connect.